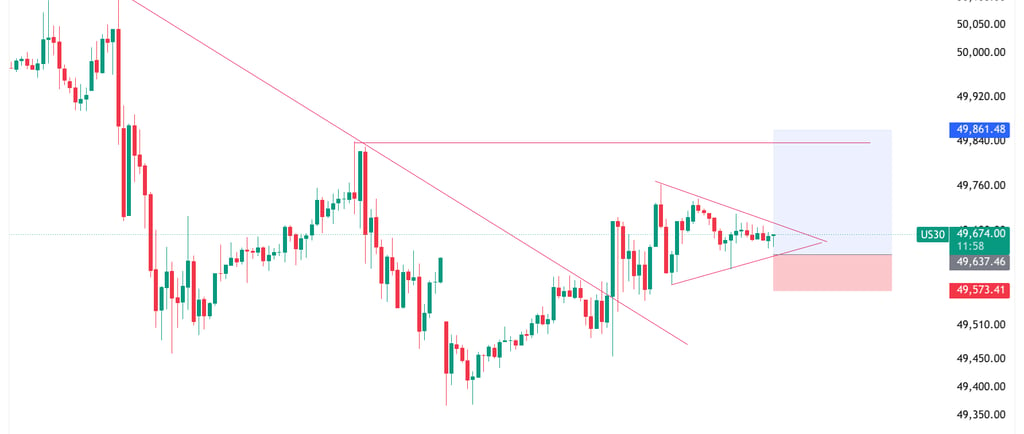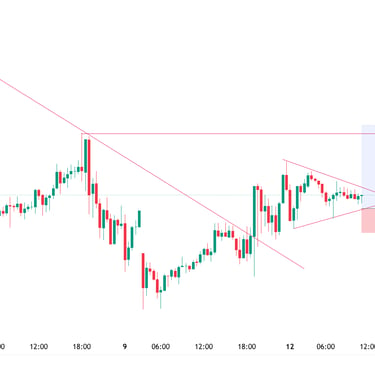
US30 consolidating inside a symmetrical triangle on the lower timeframe
US30 is currently consolidating inside a symmetrical triangle pattern on the 30M timeframe, signaling a potential breakout move ahead. Price continues holding above the 49,630 support zone while lower highs indicate short-term compression before volatility expansion. The broader structure remains cautiously bullish as long as price stays above key support. A confirmed breakout above the descending trendline and 49,750 resistance could open the door for further upside toward the 49,840–49,900 region. However, failure to hold the triangle support may trigger a bearish pullback toward 49,570 and lower. Trade Setup — US30 📈 Bullish Scenario Buy Above: 49,750 Stop Loss: 49,570 Targets: TP1: 49,840 TP2: 49,920 Bearish Scenario Sell Below: 49,630 Stop Loss: 49,760 Targets: TP1: 49,570 TP2: 49,500 ⚠️ Wait for breakout confirmation before entering, as triangle consolidations often lead to sharp volatility moves.
Jassica Harris
5/8/20241 min read